Monday 15 January 2018

Hey Windows, Where Are All My iSCSI (boot) Paths?

Oh, the Pain! iSCSI Boot with Windows Server


OK, tongue in cheek as it is not all bad. I must say I am a big fan of 'Boot From SAN' as it aligns to the desired end state of decoupling operational state from the physical world. An important attribute of a software defined, automated world. An over simplification I know, as there are a lot more to it  then just the boot process externalisation. Anyway back to the problem in hand.

I recently had a reach out to see if I could help with a customer issue that had been raised. The customer was running Windows Server in an iSCSI boot configuration, but they were not seeing all paths once the server booted into Windows. A simple enough problem statement:

"When we iSCSI boot, we can only see 2 of an expected 4 paths between the host and the array"

Simple enough problem so as a first step, I looked to recreate the configuration within the local lab. This would allow me  to determine if the path condition was as expected or something that may be aligned to an issue within the environment. Thankfully the test lab environment was very similar to the clients which comprised the following:

  • Compute:
    • Cisco UCS Blade Server (B200M4)
    • Adapter: UCS VIC 1340
      • 4 vNICS configured, 2 for general traffic and 2 for iSCSI. 
    • UCS Firmware 3.1(3c)
    • Windows Server 2016
  • Storage:
    • Pure M20 FlashArray
    • Purity 4.10.6
    • Dual 10Gb interfaces in each controller assigned to iSCSI traffic (ETH0, ETH1). In total 4 iSCSI interfaces (CT0.ETH0, CT0.ETH1, CT1.ETH0, CT1.ETH1) are configured 
  • Network:
    • Dual Cisco Nexus 5672UP Switches
    • Each controller has an iSCSI interface connected to each of the switches
To be able to leverage all four iSCSI interfaces we need to ensure we have visibility between the two iSCSI NICs configured in the UCS Service Profile and the four array iSCSI NICs. Within the lab setup this was done by configuring two static iSCSI target interfaces per iSCSI vNIC (two static targets is the maximum per vNIC). The target objective of this is to ensure that there is no single point of failure at the Network Switch or Storage Array Controller level. The diagram below shows how the connectivity is laid out.


.
Connection topology

As it demonstrates, from the iSCSI hardware initiator configuration, 4 paths are expected to be accessible. We could actually see this to be behaving as expected when powering on the Service Profile where we could see from within the Array, that all four paths were active on the initial boot.

A barebones setup though with minimal tweaking, once Windows is loaded, will only have two active paths, even with the Windows MPIO component (i.e. Windows builtin multi-pathing software) installed. Actually the number of active paths changed as follows at various stages of the boot and build process:

  • Initial boot with iSCSI boot configuration loaded had 4 paths active
  • Booted into install disk ready to commence the installation of Windows had 1 path active
  • On completion of the installation of Windows 2016, 2 paths are shown as active
  • Adding the Cisco Network drivers still only showed 2 paths active

I ran through a number of tests with varying configurations at both the UCS Service Profile and within Windows with varying results. In the end though, I was able to build and configure Windows so that all four paths were active when accessible.

To get to this point there are some considerations to keep in mind when setting your configuration parameters such as:

  • Windows only supports a single iSCSI Qualified Name (IQN)
  • Once Windows loads, only one configured target interface for each of the UCS Service Profiles iSCSI vNICs boot parameters will be active. 
  • Within Windows, there is no ability to manipulate the physical iSCSI setup state and as such, you can not activate the additional paths with multi-pathing software (i.e. Windows Component MPIO) alone. 
  • The physical iSCSI boot settings are reported within the software iSCSI initiator such as devices assigned and sessions established (the active paths) but only as Read Only and as such no settings can be changed or sessions added
  • iSCSI Hardware and Software Initiator configurations can be applied to the same Network Interface

In the end a configuration that was able to ensure four active paths were enabled from the default Windows installation with the following configuration changes:


  • Ensuring a single IQN was used within the UCS Service Profile
  • Configuring the TCP/IP details for each of the iSCSI Interfaces within Windows as per the configuration settings within the vNICS iSCSI Boot Parameters. This step is required to allow us to add sessions within the iSCSI Software Initiator
  • Installing and configuring the Windows Multi-path component MPIO
  • Configuring the Windows software iSCSI Initiator to activate all  paths by adding new sessions for the missing paths
There are more specifics around some of these step below (specifics around path policy, session authentication, etc for iSCSI are not covered as there is plenty of material available around this and is not part of the problem statement).

UCS IQN Configuration

UCS allows IQNs to be defined at 3 different points within the profile as shown in the diagram below. The ability to configure multiple IQNs is achievable as you can set IQNs at the actual vNIC level within the vNIC settings themselves or within the associated iSCSI boot parameters assigned to each of the vNICs.

UCS Service Profile IQN Configuration Points

If you do not set IQNs then an order of IQN inheritance is applied in the order as shown below.


UCS Service Profile IQN Inheritance Order
As such you can set a single IQN to be applied to all iSCSI vNICS by setting the single IQN at the iSCSI vNIC global settings section. This point of configuration within the Service Profile is shown below.

UCS Service Profile Global IQN Configuration Point


Windows Network Interface Address Details

Even though Windows is able to recognise the address details applied within the UCS Service Profile's vNICS iSCSI Boot Parameters (i.e. running 'ipconfig' within a command prompt will list the address details for each NIC), the software initiator can only apply any settings for network adaptors when the address details are set within Windows. It will actually report the settings as Read Only if you try to manipulate any settings if the address details are not present locally but configured for iSCSI Boot.

By default the Interfaces associated within Windows will have the initial DHCP based configuration set as per any new interface. You can change this to reflect the settings as configured within the iSCSI Boot Parameters.


Install and Configure MPIO

Just a quick note to ensure that two required steps are completed for MPIO once installed to ensure that storage device IDs are added into MPIO and that support for iSCSI is enabled. Once this is done a reboot will be required.


Configure iSCSI Initiator

Within the iSCSI Administration tool you are able to note that settings such as the destination target, sessions and accessible devices are reported as expected. What is unable to be done is the addition of additional sessions (paths) until the address details are set in the corresponding network interfaces within Windows. Once this is done though you can then proceed to add the missing sessions do the following steps.
                                       
Within the iSCSI Admin Tool validate that the array is listed within the 'Target Portals' in the Discovery Tab. If not add the details of each of the arrays iSCSI interfaces (assuming iSNS services are not present)


Once done switch focus to the 'Targets' tab and select the 'Connect' button


Ensure 'Multipath' selected and click Advanced


You can now create additional sessions to cover the missing paths. In the case of Pure FlashArray the missing paths can be identified at the array by looking at the connection map for the target host.


for each Session you specify the local software initiator, the interface IP and the target array IP and select OK to have it created.


Sessions can then be validated within the iSCSI Admin Tools via the 'Targets' tab <Properties> button.


Friday 22 September 2017

A PRTG Sensor for the Pure Storage FlashArray


Why A PRTG Sensor?


I was in a meeting with a good customer of Pure Storage when I noticed that their operational panel on the floor was showing a PRTG dashboard. The PRTG Network Monitor tool from Paessler is a very nice agentless monitoring solution that is able to utilise a wide range of methods to monitor any accessible system or application on your network. It is a Windows based solution but supports all required methods to gain remote insights into your services such as SNMP, SSH, Scripts, REST, WMI, packaet sniffing, etc.


I am familiar with PRTG as I use it at home to monitor my home network and various components. This is possible due to the fact that you can run 100 sensors on a free license. The wonderful world of home automation and online media have made my network as critical to my household as it is for corporatations own services. Plus it is also fun to work with solutions like this, not to mention that it provides some interesting insights into your home network when combined with a Ubiquiti setup. 

Anyway back to the task in hand, I thought that looking at how we could monitor Pure FlashArray's with PRTG could both help me to familiarise myself with the Purity API. It turns out we do have a couple of options at the Pure OpenSource community Pure/Code within the  Python and PowerShell script packs written by some clever dudes in Pure (nod to Barkz). The only consideration for these was that they are focused on the array level performance metrics, where I wanted to see what else we can keep an eye on. Also, as a new Pure employee, as stated prior, it also gives me the chance to work with the Restful API of Purity.

I can say that writing this sensor was a bit of fun and the Restful API of Purity has to be one of the most logical I have worked with. Very simple in structure, versioned to allow for supportability across a range of Purity versions, and a rich capability around those supporting actions such as filtering. It took no time at all to get comfortable with the structure, limits were only my own and those discovered within PRTG.


So What Does It Do?

I wanted to provide a good overview of the current operational health of the arrays monitored while ensuring that the reporting was not overly complicated. As a first release my focus is on array level conditions covering:
  • Array capacity status
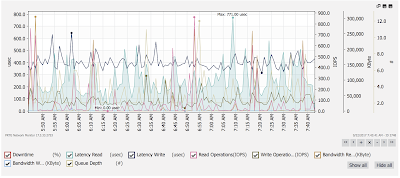
  • Array performance metrics
  • General hardware status of Controllers, Shelves and Chassis
  • General drive health
Array object sensor summary page
I have plans to add further granularity to cover 'volume performance', 'host performance' and 'protection compliance' in upcoming releases, but with the current method there is a limit of 50 channels to one sensor so still determining the best way to meet the number of instances required to monitor at that level and how to cater for lifecycle of objects that are subjected to CRUD operations (well create, update, delete anyway.

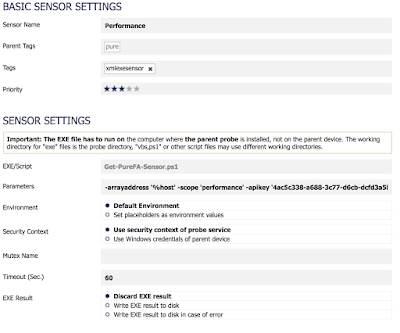
With the current script, the sensor reads the metrics from the array via a PowerShell script that directly queries each arrays Restful API. Although there is only a single script, it supports the multiple sensors through the 'Scope' parameter provided within the arguments section of each sensor (more details in installation instructions).

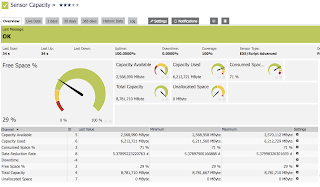
Each sensor can contain one or more channels, a channel can be thought of as a single value aligned to the sensor such as 'capacity consumed' within the 'capacity' sensor. Then as appropriate limits are assigned to the channel that define the thresholds that a channels value goes either above (maxlimit) or under (minlimit) to raise a warning or error condition for the sensor. Some channels have explicit limits set such as those related to capacity and health but others, such as the performance metrics, are left to self determine when an exceptional condition occurs based on operational patterns already recorded. For example latency may stay steady under a millisecond for normal operations but if suddenly it increases to 20 milliseconds for multiple recordings, PRTG will determine this to be an exception and raise a warning condition.

Array capacity sensor

Because each channel needs to provide a value that supports numeric comparisons to determine if limits are met, textual values returned from the array had to be converted to a representative numeric value. The textual values such as for Hardware components status to be reported as 'healthy', is enabled through the use of lookup tables included in the pack. Currently there are two included which provide lookup values for the channels in the 'Drive Health' and 'Hardware Health' sensor status values

Array Hardware Sensor
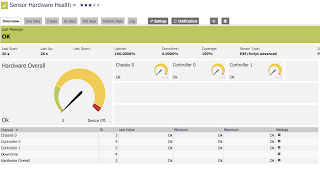
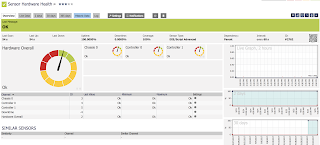
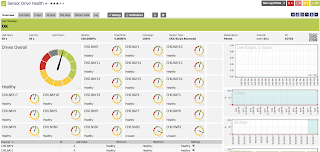
Where the Array performance and capacity sensors provide a collection of metrics related to the sensors scope of the whole array, the health sensor for hardware provides summary graphs for each major component (Chassis, Controller, Shelf) and for the Drive Health sensor, a status for each drive.

Hardware Health Sensor


For the Hardware Health sensor, summary values were required as reporting each individual hardware component that can be monitored exceeds the 50 channel to a sensor limit (not enforced but supportability and reliability can be compromised). I open to looking at alternative methods that can allow for all components to be individually reported in the future.


Drive Health Sensor


Installation


Requirements

  • First, get the scripts and associated lookup files from GitHub at Pure Storage Sensor Module. This will provide a Zip file of the required files but you can also download it directly from the GHitHub site  at 'https://github.com/davlloyd/purestorage-prtg' 
    • This set contains 4 files including:
      • Get-PureFA-Sensor.ps1 - The main PowerShell script
      • prtg.standardlookups.purestorage.drivestatus.ovl - Drive status lookup file
      • prtg.standardlookups.purestorage.hardwarestatus.ovl - Hardware status lookup file
      • readme.md - Markdown file with Installation instructions 
    • The Powershell script and lookup files need to be copied onto the PRTG server and then associated sensors created accordingly.
  • Ensure the PRTG server (or PRTG probe if running sensor from a probe)is running PowerShell 4.0

Script Installation

  1. Copy the script Get-PureFA-Sensor.ps1 to the directory 'C:\Program Files (x86)\PRTG Network Monitor\Custom Sensors\EXEXML' 
  2. Copy the two lookup files prtg.standardlookups.purestorage.drivestatus.ovl and prtg.standardlookups.purestorage.hardwarestatus.ovl to the directory 'C:\Program Files (x86)\PRTG Network Monitor\lookups\custom'
  3. Restart the Windows service 'PRTG Core Server Service'. This step is required to have PRTG read in the new custom lookup files

Sensor Creation


  1. Create a new device in PRTG with the address (IP or FQDN of the FlashArray you want to monitor
  2. Now, select <Add Sensor>. On the search field, type "Script Advanced" and then select the sensor type <EXE/Script Advanced Sensor> from the result list. 
  3. On the Add Sensor to Device screen, enter the following: 
    1. The sensor's name and tags (optional): There are currently four sensors to create. I have been naming them as follows:
      1. Capacity
      2. Performance
      3. Drive Health
      4. Hardware Health
    2. Under Exe/Script, use the Drop-down to select the script 'Get-PureFA-Sensor.ps1' from the list.
    3. Set the parameters for Array access and sensor scope as follows
      1. [ArrayAddress] (use the PRTG variable '%host' to inherit from device entry
      2. Either of the following combinations for security authentication:
        1. [username] and [password]  - This is ok for testing purposes but as password is stored in clear text not recommended for production. This will generate or read the APIKey for the account
        2. [apikey] - preferred access method. The APIKey is generated from within the Purity Console for the preferred account. You do not need to enter account details if specifying an APIKey
      3. [Scope] to set what is monitored for this sensor. Scope option values are:
        • capacity
        • performance
        • hardware
        • drive
      4. By default the sensors will be run every 60 seconds, adjust accordingly. You can get a view of time for execution by running the scripts in debug mode but ensure that it is disabled when running the script as a sensor.
-arrayaddress '%host' -scope 'hardware' -apikey '3bdf3b60-f0c0-fa8a-83c1-b794ba8f562c'
Sensor Setup

You are now ready to go. For a look at how to set a sensor up watch the video on this blog.


Sensor Screen

Performance Chart


Tuesday 24 May 2016

VMware Photon Platform, Notes from the Field - Entry Two

Time to Build The Cluster Services

Is it a bird,  plane or the Photon Platform? In the early days of Photon Platforms announcements, in my own mind, I had it pegged as a purpose built platform alternative to 'vSphere Integrated Containers (VIC)'. Keeping in mind that VICs sole purpose in life is to enable Containers in vSphere with a cool concept of a 1:1 alignment of VM to Container. This meant a container can have all the flexibility inherent in a container with all the control and security of a VM. Alright come on down Photon Platform just bigger, better more focused right? Well not really....

So one thing that strikes you with the Photon Platform is the flexibility of choices it provides. From a scheduling cluster manager's perspective you can utilise Swarm, Kubernetes or Mesos out of the box. On the other side, this is ESXi after all (marketing slides aside that keep alluding to the slimmed down hypervisor) so it will happily run Virtual Machines  and Containers side by side (well containers within VMs anyway).

Being able to support both is important as not all workloads are created equal in this new age. Let's be honest, not everyone working in this new 'Cloud Native' world has grown a beard, rides a bicycle and wears skinny jeans, there is a variety of personalities that need to be catered for. What is common is we don't all need the assurance and crutches that come from the more traditional platforms. If I fall over it is ok, I will just get myself back up. In the traditional world I would have crutches, cushions, people watching me, ready to catch me if a stumble, etc. This is because in this traditional world I am seen as needed to be treated like a VIP (i.e. Very Important Process) and require all the care of advanced services to keep me going (and the costs associated with those advanced services). Sometimes a more traditional approach may be preferable to containerising (is that a word?) the workload so Virtual Machines live on even if they are seen as cattle (I'll let Duncan Epping define that for you).


This mixed capability is emphasised by the fact that all the management VMs are hosted out of the hypervisors that are flagged as Management hosts (you designate if a host is 'Management' so participates in the control plane or 'Cloud' which only provide a hosting platform capacity, or both). Anyway myself for one, I'm a big fan as by including the ability to host containers and VMs as this provides that flexible, cost and scale focused platform I want without having to look at alternatives such as Openstack. Add to this the fact that it also includes support for the 3 main container and workload cluster scheduling services out of the box and your covering a lot of bases for possible consumers of Photon Platform.

My personal choice is to go forward with Mesos at this stage as it gives me the open choices I want when paired with Marathon. I have played with all three though on Photon as all it takes is that you import the 3 images and enabled the 3 cluster types. I am not here to tell you how to do this or how to create a cluster as there are plenty of blogs that do that, I just want to give my view and some lessons I learnt on the way that may help someone out there. 

It is important to note that when creating clusters, they align to there traditional model and not some Hybrid like in VIC. What I mean by that is that if you create a Docker Swarm cluster, the slave nodes will be running the containers in a shared multi-node format. The nodes are utilising PhotonOS as there Operating System but we don't have the 1:1 Container to VM alignment of VIC. This is important to consider as your sizing of those nodes should reflect your needs. There are default 'Flavors' (remember Flavors define the resource configuration profiles) aligned to the different clusters but they can be overwritten at the API, CLI level when creating a cluster.

This system is built as a multi-tenant service from the ground up so when you create workloads they need to be placed within a Project assigned to a Tenant. As you would expect, a Tenant gets an allotment of Resources (vCPUS, memory, Disk Capacity, VMs, etc) which are then subdivided into Resource Tickets (think Gold , Silver Bronze classes or whatever). A Project is then assigned a Resource Ticket which it then further carves out a resource reservation /limit out of. All the way down this logical structure you can add Access Controls via the integration with VMware Lightwave


So importantly as a tenant, I can create my own cluster service to host workloads or just create VMs directly based on virtual appliances or virtual disks imported into the system.  I can then control my VM workloads via the CLI and API into Photon Platforms Controller VM as you would of normally via vCenter, or use the cluster manager of choice to control the workloads within them.

As a final statement on the installation of the clusters what I can say is this. I have built all 3 flavours using simple sandbox methods as well as going through the full manual processes (more then once as I like punishment) and there is a highly compelling value proposition here. To be able to create these services as you require them  on a production class platform so simply is huge. There will be challenges with the way it is done now such as how do they stay close to release parity (hence the compelling part of it being Open Source), but this is a new era platform that brings together the traditional on-premise controls to the new cloud native era's service requirements in the one stack. This is great stuff for a version 0.8 release!

Some Notes On Cluster Enablement:


Be Wary Of Resource Stinginess
My nature is to give less then more when allocating resources. This sent my on a dance to the requirements of the various clusters as I did not have enough resources aligned to my Project.  Just be aware of the sizing needs (they vary of course depending on your own configuration requirements) and if you are resource constrained, use custom 'Flavors'. I prefer to bang my head on the wall so got very use to the 'Photon Cluster Create' operation being closely followed by the 'Photon Cluster Delete' operation to delete the failure and started again (side note, it didn't like me trying to recreate deleted clusters with the same name, didn't ping this down but got into the habit of using unique names each attempt) :)

Cluster Creation IP Address Requirements
Within the instructions it is emphasised that DHCP needs to be disabled / not present in the management network which is where the clusters are installed. Ironically, if DHCP is disabled the cluster deployment fails with a 'Unable to Obtain an IP Address' error. To progress forward I re-enabled DHCP in the management network (the one that the Photon Controller is installed into). The more accurate requirement description is to ensure the static IP addresses you provide (i.e. for the 'zookeeper' servers in Mesos and 'etcd' servers in Kubernetes and Swarm) are not also served within the active DHCP scopes.

Those Damn Certificates
Maybe you lucky that your company provides an open network and all traffic is created equal. That is not the case in mine, we trust no-one and inject ourselves into every certificate coming into the network. Any problems with this is mitigated by adding our own certificates into the trusted root but this is difficult for those environments that are created dynamically as these clusters are.

When you create a cluster PhotonOS based VMs are created corresponding to your configurations requirements (i.e. how many slaves, how many provide the interconnect service) and are then configured by templates contained on the Controller. Where the certificates being trusted becomes critical is the fact that the services run as containers within the VMs and as such the images need to be downloaded as part of the initial execution. The end result is the cluster creation operations fail with 'Time Exceeded' errors.

Anyway its an easy fix! I edited the template files contained in the controller directory '/usr/lib/esxcloud/deployer/scripts/clusters' with descriptive names such as 'kubernetes-master-user-data-template' to inject our certificates into the VMs. This at least made that problem go away and you of course could do this to apply any other customisations that may be required. It would be nice to see some option in the future to inject certificates into the process. I also provided this same feedback for 'vSphere Integrated Containers' as had the same problem there!